Blog Article
Try Our New Analytics Dataset!
Author
Debnil Sur
Publishing date
Analytics
Data
We’re excited to announce that the Stellar Development Foundation is releasing a daily-updated analytics dataset to enable fast analysis of the entire history of Stellar network transactions. Stellar is an open financial network, and this dataset makes it easier than ever to uphold our values of transparency and openness.
What’s the Data?
The data we’re exposing summarizes the state of the Stellar ledger, as well as the full history of transactions on the network. Horizon typically stores this information in a Postgres database. We’ve put this dataset on Google BigQuery, which has made large-scale queries 10 to 100 times faster! Note that each table is updated daily, around 7 AM PST, through an in-house data pipeline.
- accounts: Contains all accounts’ current state (well, as of 7 AM Pacific ;)).
- history_accounts: Maps each account ID to a Stellar address. Most useful with trades, which refers to accounts using these IDs.
- history_assets: Maps each asset ID to a Stellar asset. Most useful with trades, which also refers to assets using these IDs.
- history_ledgers: Contains all ledgers.
- history_operations: Contains all operations.
- history_transactions: Contains all transactions.
- offers: Contains all offers.
- trust_lines: Contains all current trustlines.
- enriched_history_operations: the history operations table, but on steroids. Includes the state of each operation; joined with its transaction; and joined again with its ledger (which contains the closing time). Super useful for any operation-level question!
Where’s the Data?
Note: while SDF is hosting the dataset and paying hosting costs, we will not cover queries by external users. Fortunately, individual queries are quite cheap — typically, just a few cents! Plus, Google offers a generous amount of trial credits for new Google Cloud users. Here are instructions for setting up a free trial. After that, make sure to set up a project, or you won't be able to query any data.
Enough talking. Here’s the data.
But I want an example!
Of course! More than happy to oblige. Here are three! :)
This query is a warmup: which accounts have the most XLM? Try running it yourself to find the answer!
SELECT
 account_id,
 balance
FROM `crypto-stellar.crypto_stellar.accounts`
ORDER BY balance DESC;
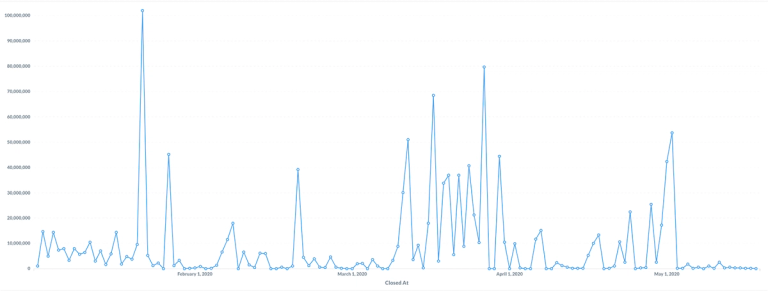
This one is more complex: how much was paid in a specific asset — per day — on the Stellar decentralized exchange (DEX)? In this example, we’re using Cowrie’s NGNT. See if you can modify it yourself and try a different asset!
SELECT
 DATE(closed_at) AS close_date,
 SUM(amount) AS daily_amount,
FROM `crypto-stellar.crypto_stellar.enriched_history_operations` eho
WHERE
 type = 1 AND -- Type: Payment
 (asset_code = "NGNT" AND asset_issuer = "GAWODAROMJ33V5YDFY3NPYTHVYQG7MJXVJ2ND3AOGIHYRWINES6ACCPD") AND -- Asset code and issuer are NGNT and Cowrie
 eho.from != eho.to AND -- Different sender and recipient to exclude arbitrage ops.
 (successful = true OR successful IS NULL) -- Only include successful operations.
GROUP BY close_date
ORDER BY close_date DESC;

Finally, here’s some serious number-crunching: how many trades were there of a specific trading pair — per day — on the DEX? For this example, we’re using XLM/AnchorUSD, in both directions. As above, try your own pair out!
-- Make a table of ID to "base_asset" (concatenation of type, code, issuer).
WITH base_assets AS (
 SELECT
 id,
 CONCAT(asset_code, '-', asset_issuer) AS base_asset
 FROM `crypto-stellar.crypto_stellar.history_assets`
),

-- Make a table of ID to "counter_asset" (concatenation of type, code, issuer).
-- We have multiple tables, as it seems you cannot rename a column in a left join.
counter_assets AS (
 SELECT
 id,
 base_asset AS counter_asset
 FROM base_assets
)
-- Select the number of different base accounts, counter accounts, and trades.
-- Group by date, base asset, and counter asset.
-- We use AnchorUSD as an example.
SELECT
 DATE(ledger_closed_at) AS close_date,
 COUNT(DISTINCT(history_operation_id)) AS num_trades,
FROM `crypto-stellar.crypto_stellar.history_trades`
LEFT JOIN base_assets ON base_assets.id = base_asset_id
LEFT JOIN counter_assets ON counter_assets.id = counter_asset_id
WHERE
(base_asset="USD-GDUKMGUGDZQK6YHYA5Z6AY2G4XDSZPSZ3SW5UN3ARVMO6QSRDWP5YLEX" AND counter_asset="-") OR
 (base_asset="-" AND counter_asset="USD-GDUKMGUGDZQK6YHYA5Z6AY2G4XDSZPSZ3SW5UN3ARVMO6QSRDWP5YLEX")
GROUP BY close_date, base_asset, counter_asset
ORDER BY close_date DESC, num_trades DESC

Why an Analytics Dataset?
From its design and inception, the Stellar protocol has used industry-standard database management systems like PostgreSQL. This design choice makes the setup and maintenance of a Stellar Core node and accompanying Horizon API server relatively simple. Postgres is tried and tested, open source, and incredibly reliable and stable, so it's great for storing ledgers, transactions, and the other data and metadata of the Stellar network.
Unfortunately, while great for storage, Postgres and similar systems aren’t quite as good at executing queries at scale. Most database systems fall into one of two categories — on-line transaction processing (OLTP) and on-line analytical processing (OLAP) — and Postgres is an example of the former. OLTPs efficiently process a large number of short, on-line transactions and reliably store their results, even in multi-access environments. But because these systems are optimized to handle these smaller transactions quickly, they don’t handle complex queries as well. It’s not their fault — that’s just not what they’re designed to do! It's like a sprinter trying to lift weights.
That’s where OLAPs come in. They update more slowly and are generally more expensive to query. But they're also optimized to efficiently handle massive queries with many joins. One popular tool in this vein is Google BigQuery. We decided to use it for our own data warehousing for a few key reasons. We use GSuite across SDF so it plays nicely with our organizational tools. It also offers easy integration with other Google Cloud offerings, like Cloud Storage, Functions, and Drive, which makes an end-to-end analysis pipeline far easier to build. Finally, it has widely accessible documentation, which simplified developing the pipeline and onboarding other users.
We hope this was helpful. Feel free to reach out to me on Twitter with any questions: @debnilsur. Happy querying!